Masterclass: Understanding Financial Statements
Founders often live inside their P&L without stepping back to see how it connects to cash and the balance sheet and that gap can be costly when it's time to raise, forecast, or simply understand whether the business is actually healthy. This masterclass breaks down the three core financial statements every founder needs to read fluently: the P&L, which shows performance; the cash flow statement, which shows liquidity and runway; and the balance sheet, which shows financial position. Using real examples :a sale, an amortization, it shows exactly how a single transaction ripples across all three.
The figures presented are fictitious and provided solely for illustrative purposes.
Profit & Loss Statement - Definition and items
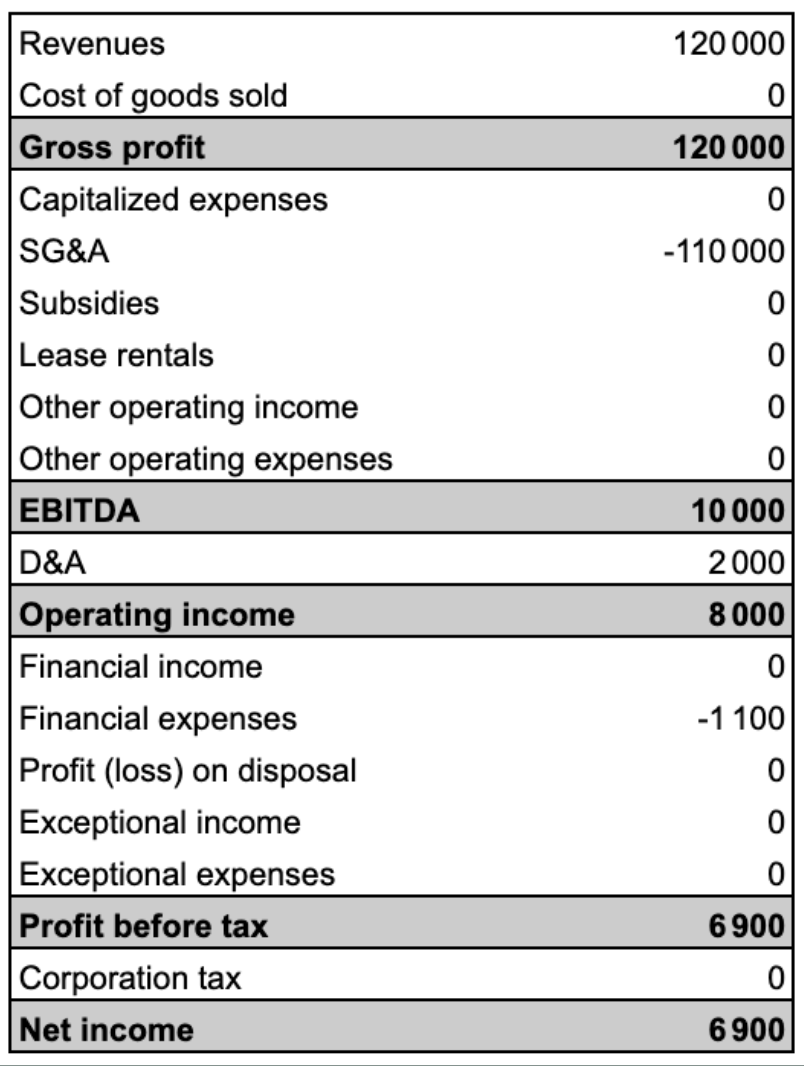
P&L shows financial performance over a specific period (month, quarter, or year)
COGS = cost of production or sale (raw materials, manufacturing expenses, salaries of Sales representatives…)
SG&A = operating costs of running the business (salaries, rent, marketing…) which are not directly tied to the production of goods.
EBITDA = key indicator of a company's operating performance without non-operational factors.
- Helps in comparing the profitability of different businesses, especially in different tax and interest rate environments.
- Important for assessing a company's ability to generate cash flow and service debt.
Startups almost always have negative EBITDA as it is part of a growth strategy to invest in research, development, and customer acquisition.
EBITDA Margin % = (EBITDA / Total Revenue) x 100
Assess operational performance, easier to compare and evaluate efficiency and profitability of businesses
Profit & Loss Statement - Example
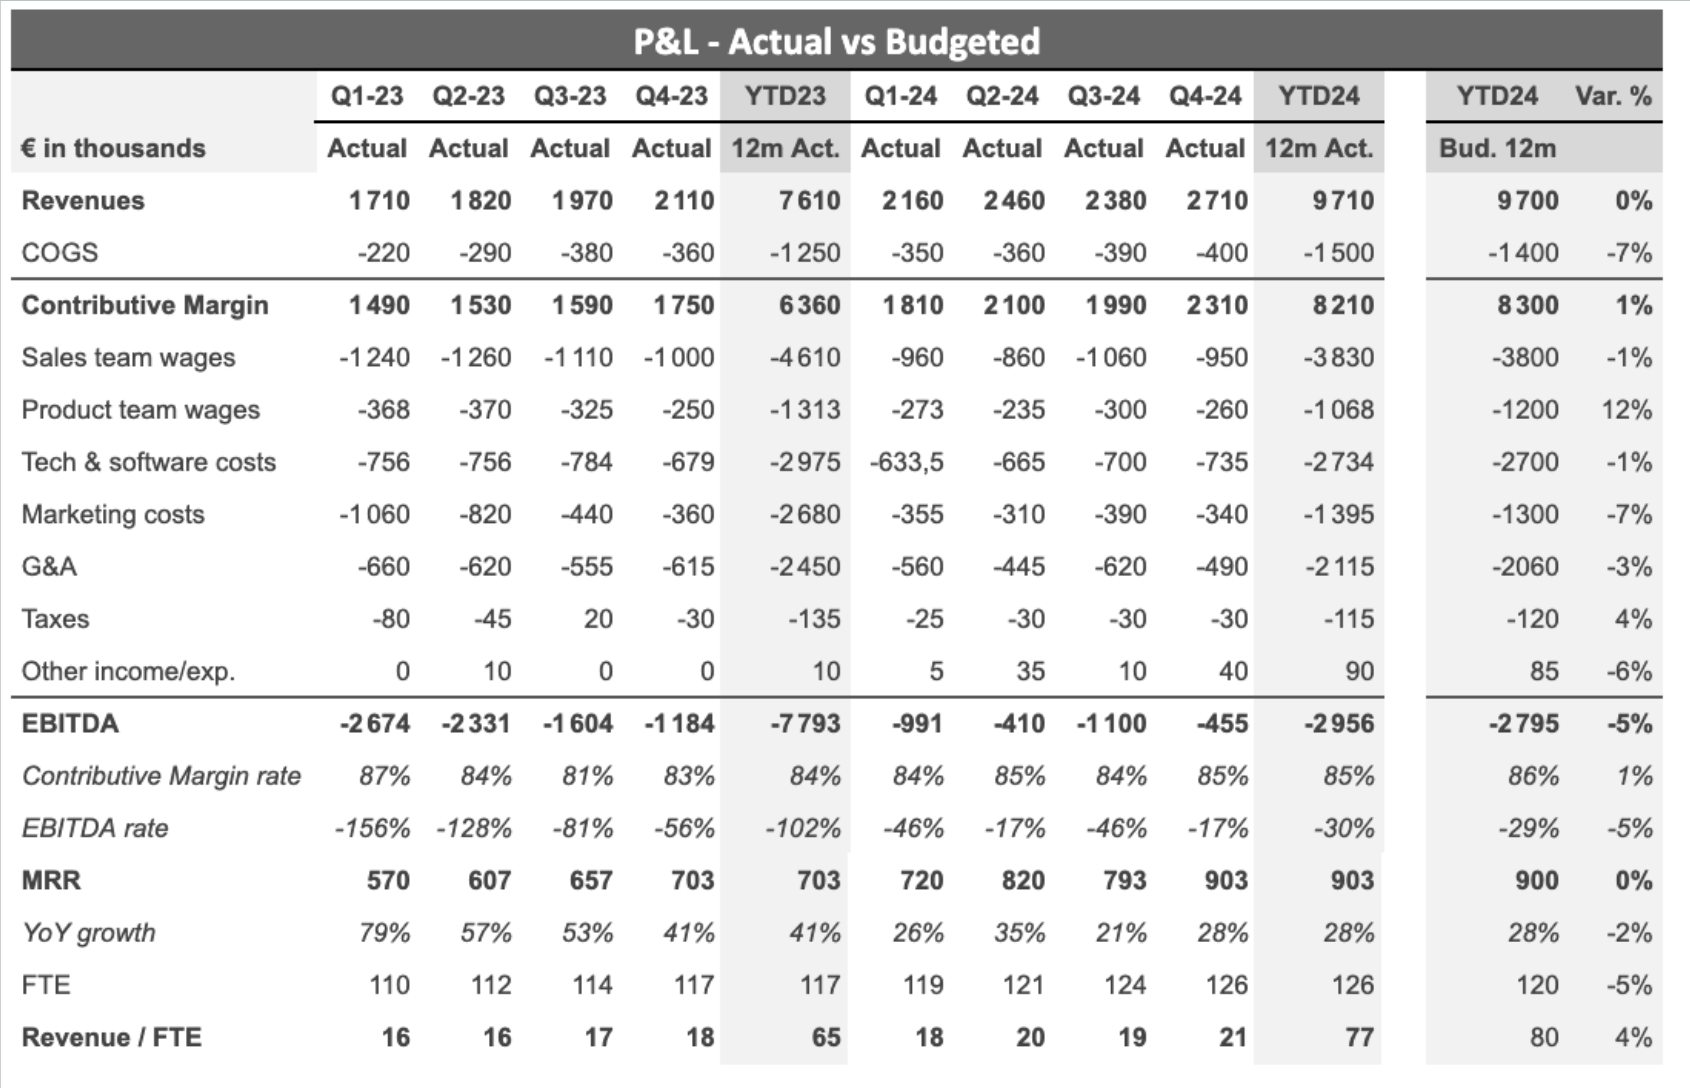
Budget vs. Realized analysis to reflect performance and needs for a reforecast or readjust strategic decisionsYoY analysis too to reflect the growth
The contributive margin is the difference between a company's revenue and its cost of goods sold (COGS). Direct costs related to sales are included. It represents the portion of revenue available to cover fixed costs and generate profit.
Contains non-accounting metrics such as:
- MRR = important so that we know how much revenue they are sure to get (approx. 100% of revenues is MRR)
- FTEs so that you can compare it to payroll
Startups often incur negative EBITDA, intentionally prioritizing growth and development over short-term profitability
To monitor this growth efficiency, we check that this ratio goes toward 1 (which is what a late stage company should aim):
Net burn / Net new revenue (12 months)
A lower ratio (<1) is preferable because it indicates that the company is generating more new revenue than it is burning cash
Cash Flow Statement - Definition and items
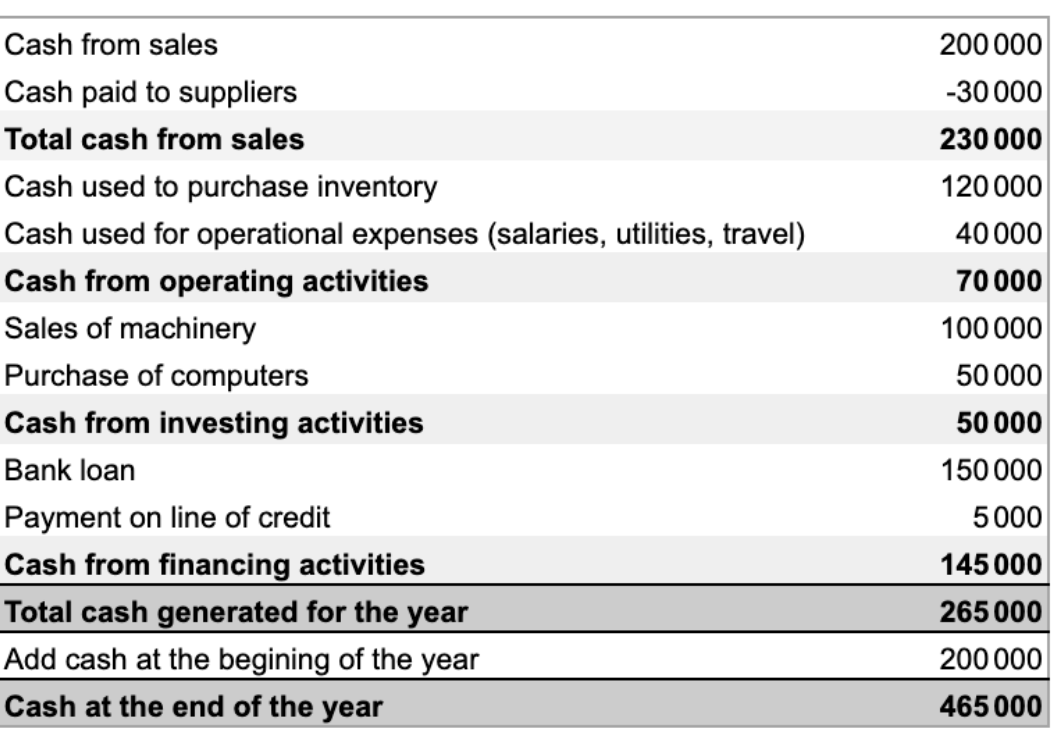
Cash flow statement helps us understand how money is being managed within the company
Clear picture of a company's liquidity, ensuring that there's enough cash to cover operating, investing and financing activities
- While the P&L is about revenues and expenses, the cash flow statement focuses on cash transactions, ensuring we understand how cash is flowing in and out of the business.
Track the cash burn and cash burn rate => identifies areas where cost control is necessary.
By knowing the cash burn rate and the current cash reserves, we can define how long the company can operate without running out of cash = runway
- It is vital for a startup to follow those metrics in order to have a constant view on how can they sustain until next round of financing or profitability
Cash Flow Statement - Example
Objective is to understand what happens between Cash BoP and Cash EoP
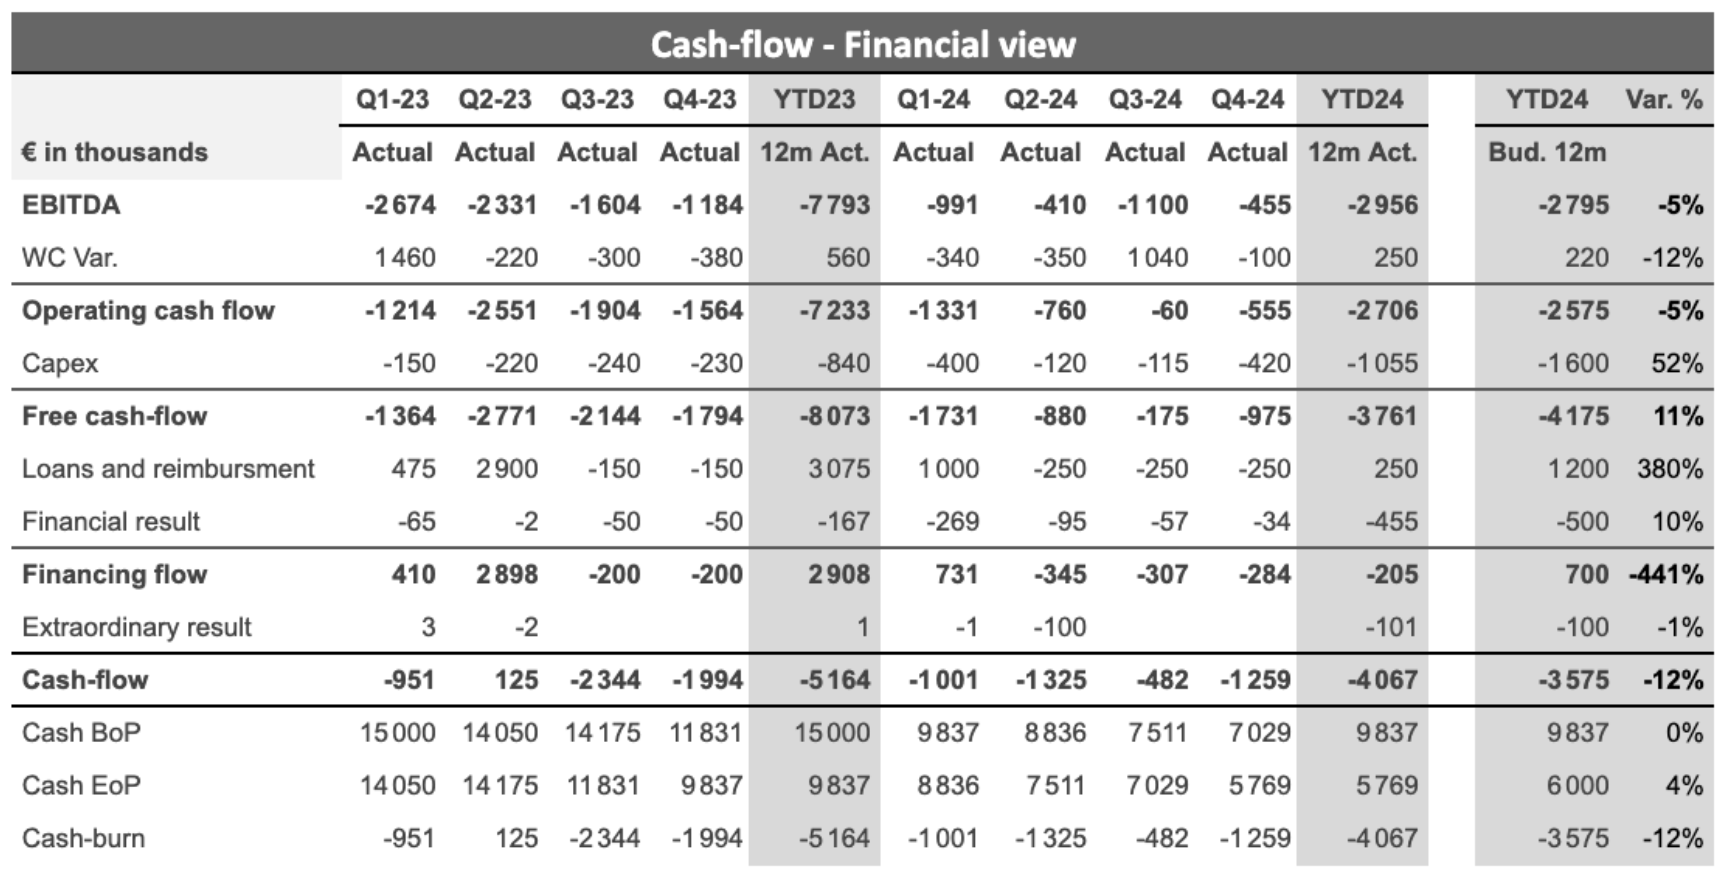
- Cash-flow from operation : Operational flow can be calculated from EBITDA by adding the variation of your working capital, the capital expenditure and the tax.Working capital is the money a company has available for its everyday expenses, calculated by subtracting what it owes from what it owns.
- Cash-flow from investments: Represented by CAPEX in the statement
- Cash-flow from financingFinancing flow mostly shows the loans and interest payments that the company have
CF operational + investments + financing = cash-flow of the period
FY cash variation = (5 769 - 9 837) = - 4 067
Monthly cash burn (from last quarter) = (1 259 / 3) = 420
With this burn, the company's runway is 14 months (5 769 / 420)
Balance Sheet - Definition and items
Balance sheet is a snapshot of a company's financial position at a specific point in time
It helps assess a company's financial health and stability
Shows what a company owns (assets), what it owes (liabilities), and the residual interest (equity) for its shareholders
Assets — What the company owns
- Non-current assets: These include buildings, vehicles, IT equipment, etc. These costs are amortizable
- Current assets: This includes the company's cash position (from cash-flow statement) and short-term receivables from customers
Liabilities + Equity — What the company owes
- Shareholders' equity: Includes the company's share capital and net income (from P&L)
- Non-current and current liabilities: This includes the financial debts of the company. This also includes the short-term payables to suppliers
Balance Sheet - Example
Net debt = Financial Debts - Cash & Cash Equivalents = 4 200k + 500k - (8 500k + 5 500k + 500k) = - 9 800k€
The aim for a company is not using its equity to run the operation but its working capital
Working capital = current assets – current liabilities.
Relation between the statements - Example of a sale (simplified)
The company makes a sale for €100k
(for this example, we assume that no additional sales effort, and therefore no additional cost, was made to achieve this sale, we also assume that there are no VAT)
Impact on P&LWhen payment is receivedRevenue ↗ by 100k€Net income ↗ by 70k€100k€ * (1 - tax %), with 30% tax rate (assumption)
Impact on cash-flowWhen payment is receivedCash from sales ↗ by 100k€
Impact on balance sheetBefore payment is receivedAccounts receivable ↗ by 100k€When payment is receivedAccounts receivable ↘ by 100k€Cash & cash equivalents ↗ by 100k€At the end of the yearShareholder's equity ↗ by 70k€
Relation between the statements - Example of an amortization (simplified)
The company buys a computer for €1k. They can amortize the cost over 5 years, i.e. €200 per year. What are the impacts on the financial statements of an amortization?
Impact on P&LD&A ↗ by 200€Net income ↘ by 140€200€ * (1 - tax %), with 30% tax rate (assumption)
Impact on cash-flowNo impact on cash flow as it is a calculated expense
Impact on balance sheetProperty, plant & equipment ↘ by 200€At the end of the yearShareholder's equity ↘ by 140€


